달력

4

« 2024/4 »

  • 1
  • 2
  • 3
  • 4
  • 5
  • 6
  • 7
  • 8
  • 9
  • 10
  • 11
  • 12
  • 13
  • 14
  • 15
  • 16
  • 17
  • 18
  • 19
  • 20
  • 21
  • 22
  • 23
  • 24
  • 25
  • 26
  • 27
  • 28
  • 29
  • 30

'분류 전체보기'에 해당되는 글 138

  1. 2008.02.16 Errors and residuals in statistics
  2. 2008.02.14 gnu plot
  3. 2008.02.13 개발속도 단축
  4. 2008.02.13 논문 아이디어
  5. 2008.02.13 황규백 교수님 면담 (1)
  6. 2008.02.12 force-directed placement 2
  7. 2008.02.11 사용자 경험(User eXperience)
  8. 2008.02.11 추천시스템 서버적용 애플리케이션 아이디어
  9. 2008.02.10 시각화의 한 방법
  10. 2008.02.10 day 26_2
2008. 2. 16. 14:29

Errors and residuals in statistics 개념2008. 2. 16. 14:29

Errors and residuals in statistics

From Wikipedia, the free encyclopedia

Jump to: navigation, search

In statistics and optimization, the concepts of statistical error and residual are easily confused with each other.

A statistical error is the amount by which an observation differs from its expected value; the latter being based on the whole population from which the statistical unit was chosen randomly. The expected value, being for instance the mean of the entire population, is typically unobservable. If the average height in a population of 21-year-old men is 1.75 meters, and one randomly chosen man is 1.80 meters tall, then the "error" is 0.05 meters; if the randomly chosen man is 1.70 meters tall, then the "error" is −0.05 meters. The nomenclature arose from random measurement errors in astronomy. It is as if the measurement of the man's height were an attempt to measure the population average, so that any difference between the man's height and the average would be a measurement error.

A residual (or fitting error), on the other hand, is an observable estimate of the unobservable statistical error. The simplest case involves a random sample of n men whose heights are measured. The sample average is used as an estimate of the population average. Then we have:

  • The difference between the height of each man in the sample and the unobservable population average is a statistical error, and
  • The difference between the height of each man in the sample and the observable sample average is a residual.

Note that the sum of the residuals within a random sample is necessarily zero, and thus the residuals are necessarily not independent. The sum of the statistical errors within a random sample need not be zero; the statistical errors are independent random variables if the individuals are chosen from the population independently.

In sum:

  • Residuals are observable; statistical errors are not.
  • Statistical errors are often independent of each other; residuals are not (at least in the simple situation described above, and in most others).

Contents

[hide]

[edit] Example with some mathematical theory

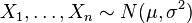
If we assume a normally distributed population with mean μ and standard deviation σ, and choose individuals independently, then we have

X_1, \dots, X_n\sim N(\mu,\sigma^2)\,

and the sample mean

\overline{X}={X_1 + \cdots + X_n \over n}

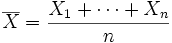
is a random variable distributed thus:

\overline{X}\sim N(\mu, \sigma^2/n).

The statistical errors are then

\varepsilon_i=X_i-\mu,\,

whereas the residuals are

\widehat{\varepsilon}_i=X_i-\overline{X}.

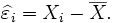
(As is often done, the "hat" over the letter ε indicates an observable estimate of an unobservable quantity called ε.)

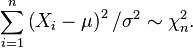
The sum of squares of the statistical errors, divided by σ2, has a chi-square distribution with n degrees of freedom:

\sum_{i=1}^n \left(X_i-\mu\right)^2/\sigma^2\sim\chi^2_n.

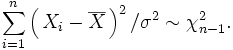
This quantity, however, is not observable. The sum of squares of the residuals, on the other hand, is observable. The quotient of that sum by σ2 has a chi-square distribution with only n − 1 degrees of freedom:

\sum_{i=1}^n \left(\,X_i-\overline{X}\,\right)^2/\sigma^2\sim\chi^2_{n-1}.

It is remarkable that the sum of squares of the residuals and the sample mean can be shown to be independent of each other. That fact and the normal and chi-square distributions given above form the basis of confidence interval calculations relying on Student's t-distribution. In those calculations one encounters the quotient

{\overline{X}_n - \mu \over S_n/\sqrt{n}},

in which the σ appears in both the numerator and the denominator and cancels. That is fortunate because in practice one would not know the value of σ2.

[edit] References

  • Residuals and Influence in Regression, R. Dennis Cook, New York : Chapman and Hall, 1982.
  • Applied Linear Regression, Second Edition, Sanford Weisberg, John Wiley & Sons, 1985.

[edit] See also

[edit] External links

:
Posted by Kwang-sung Jun
2008. 2. 14. 22:08

gnu plot netflix prize/시각화2008. 2. 14. 22:08

gnuplot -> 그래프..
:
Posted by Kwang-sung Jun
2008. 2. 13. 14:52

개발속도 단축 netflix prize/기타2008. 2. 13. 14:52

주어진 셋을 축소시켜서

프로그램을 짠다.(왜냐면, 기본 데이터는 너무나도 양이 커서, 테스트에 지나치게 많은 시간이 소모되기 때문이다.)

예를 들면 한 영화에 대한 사용자 레이팅은 100건 까지만 인식한다든가...
(그렇게 하면 rating한 유저의 명수는 줄어들겠지만..)

알고리즘의 성능은 떨어지겠지만, 개발 과정에서는 크게 상관없으므로...!

:
Posted by Kwang-sung Jun
2008. 2. 13. 14:32

논문 아이디어 netflix prize/기타2008. 2. 13. 14:32

k-NN
factorization
RBM(Restricted BoltzMann Machines)
asymmetric factor models

네 가지의 blending(ensemble)을 이용한 실용적인 추천시스템 고안
네 가지의 주요 알고리즘의 성능 분석(비교대조)

:
Posted by Kwang-sung Jun
2008. 2. 13. 11:36

황규백 교수님 면담 (1) netflix prize/논문 미팅2008. 2. 13. 11:36

1. Ax = b 원래의 복잡한 연산을 매트릭스로 압축시켜놓은 것일 뿐.

2. 공부내용 정리 및 문서화는 어떻게? -> 답없음

3. machine learning 교재 추천. MACHINE LEARNING, McGraw Hill, TOM. M. MITCHELL

4. 교수님께서 논문쓰실때 구현은 - 언제나 C, 행렬처리는 MATLAB을 쓰는것이 더 빠르다.
JAVA 기계학습 라이브러리 - WEKA
S, S+
R (통계 패키지)

5. 논문 -> 정보과학회에 낼 수 있을 것 같다.(2007년에는 4월 17일경에 제출 마감이 있었다.)
학회는 international학회라해서 항상 규모가 있는 것은 아니다. 일단 국내 학회에 낸 후, 국외에 내도 늦지 않다.

다음은 <포스터 발표>

사용자 삽입 이미지

다음은 <구두 발표>
사용자 삽입 이미지

구두 발표


6. 논문 검색 -> 그냥 구글을 이용하는 것이 편하다.
* review article ->새로운 것을 제안하는 것이 아니라 기존에 있는 것들을 collect하여 쓰인 논문들. 학습하기에 좋다.
* communication paper
* 논문 검색 사이트 : DBLP, cite seer 가 CS에서는 가장 큰 사이트

7. 시각화 : pajek - 5000이상의 데이터가 넘어가면 버벅대더라.
* collaborative filtering은 이수원 교수님 랩 쪽이 더 잘 알고 있을 것이다.

:
Posted by Kwang-sung Jun
2008. 2. 12. 11:01

force-directed placement netflix prize/시각화2008. 2. 12. 11:01

Re: A question about your visualization of Netflix movie data set.

The movies can be thought of as nodes in a graph, and the similarities can be thought of as weighted edges.  Then a force directed layout is used to layout the graph.  Take a look at:
 
 
Todd


On 2/10/08, 전광성 <deltakam@naver.com> wrote:

How are you?


I'm korean students who is interested in developing recommender system.(not commecially, just for my study and learning)


I have a question about your visualization of netflix movie data set.


I understand that you used movie similarity extracted from the article you mentioned in your web site.

However, how did you use it? I mean, we need 2 coordinate, x and y axis... 1 axis (x) can be drawn from the similarity, but, how about y axis? did you use different form of similarity indicator for another axis?


I got a plan on exhibiting my recommender system at IT festival in South Korea held by SAMSUNG SDS, and I DO need to visualize my system, but struggling with how to show the principle of the algorithm....


plz help me

:
Posted by Kwang-sung Jun
2008. 2. 11. 16:15

사용자 경험(User eXperience) 개념2008. 2. 11. 16:15

사용자 경험

위키백과 ― 우리 모두의 백과사전.

Jump to: navigation, 찾기

사용자 경험(영어: User Experience 유저 익스피리언스)은 사용자가 어떤 시스템, 제품 혹은 서비스를 직, 간접적으로 이용하면서 느끼고 생각하게 되는 총체적 경험을 말한다. 단순히 기능이나 절차상의 만족뿐 아니라 전반적인 지각 가능한 모든 면에서 사용자가 참여, 사용, 관찰하고 상호 교감을 통해서 알 수 있는 가치있는 경험이다. 긍정적 사용자 경험의 창출은 산업 디자인, 소프트웨어 공학, 마케팅, 및 경영학의 중요 과제이며 이는 사용자의 니즈의 만족, 브랜드의 충성도 향상, 시장에서의 성공을 가져다 줄 수 있는 주요 사항이다. 부정적 사용자 경험 (Poor User Exprience)는 사용자가 원하는 목적을 이루지 못할 때나 목적을 이루더라도 감정적, 이성적으로나 경제적으로 편리하지 못하거나 부정적인 반응을 불러일으키는 경험을 하게 되는 경우 발생할 수 있다.

긍정적인 사용자 경험을 개발, 창출하기 위해서 학술적, 실무적으로 이를 만들어 내고자 하는 일을 사용자 경험 디자인 (User Experience Design)이라고 하며 영역에 따라 제품 디자인(Product Design), 인터랙션 디자인(Interaction Design), 사용자 인터페이스 디자인 (User Interface Design), 인포메이션 아키텍처 (Information Architecture), 사용성 공학 (Usability) 등의 분야에서 주로 연구 개발되고 있다. 그러나 사용자 경험은 다학제적이며 다분야의 총체적 시각에서 접근해나가야 하는 핵심적인 원리를 바탕으로 한다.

목차

[숨기기]

[편집] 역사

사용자 경험은 사용자 컴퓨터 인터랙션 연구에서 사용된 개념이며 아직도 많은 사용자 경험의 원리가 컴퓨터 공학 분야의 소프트웨어 및 하드웨어 개발에서 비롯되었다. 그러나 이 개념은 현재에 와서는 컴퓨터 제품 뿐만 아니라 산업을 통해 제공되는 서비스, 상품, 프로세스, 사회와 문화에 이르기까지 널리 응용되고 있다.

초기의 사용자 경험 (User Experience)에 관한 언급은 에드워드(E.C.Edwards)와 카시크(D.J. Kasik)의 글 사이버 그래픽 터미널에서의 사용자 경험(User Experience With the CYBER Graphics Terminal,Proceedings of VIM-21, pp 284-286, October, 1974)에서 찾아 볼 수 있다. 이후 1970년대와 1980년대에 수많은 연구가 이루어졌으며 주로 인간 중심의 디자인 (Human Centered Design, UCD)의 맥락에서 인간과 기계간의 상호교감에서 긍정적 경험의 가치를 만들어내고자 하였다. 특히 애플 컴퓨터의 직원이였던 도널드 노먼 은 1993년에 사용자 경험의 설계자로서 이후 애플 컴퓨터의 디자인에 영향을 주었으며 인간-컴퓨터 상호작용을 연구하는 이들에게 큰 영향을 주었다.

1998년에는 조셉 파인(B. Joseph Pie II)과 제임스 길모어(James Gilmore)가 경험 경제로의 초대 (Welcome to the Experience Economy)라는 기사를 하버드 비즈니스 저널에 발표하고 1999년에는 이를 저서로 내놓아 경제, 경영계에 사용자 경험에 대한 관심을 불러 일으켰다. 그들은 농업경제에서 산업경제로 각 단계의 발전을 이루는 동안 상대적으로 우수한 조건의 제품으로 차별화 시키기 위해 선도 기업 들은 자신들의 제품, 서비스의 독특한 경험을 만들어 내었다고 주장하였다. 특히 월트 디즈니사 같은 엔터테인먼트기업들은 경험의 가치에 대해 중요시 여기어 일관된 테마와 테마가 가지는 긍정적인 면을 강조하고 부정적인 면을 제거 함으로서 시청각적인 메시지를 고객들에게 전달하고 이러한 경험에 의한 기억이 나중에도 기념할만한 것이 되도록 하며 최종적으로는 오감을 통한 경험과 기억을 강화하도록 그들의 제품과 서비스를 만들려고 노력하였다는 것을 설명하였다.

:
Posted by Kwang-sung Jun

메뉴 에서 선택

1. 서버에서 어떤 데이터 베이스에 어떤 테이블, 어떤 칼럼에정보가 들어있는지 그 정보를 읽도록 한다.

2. 그 데이터를 기반으로 바이너리 데이터를 생성해 메모리에 올린다.

3. 메모리에 올린 데이터로 preprocessing data를 생성한다. (유사도 + 행렬 A)
-> 이 와중에 시각화를 시키는 것이 가능하다 - 유사도를 이용하여 영화의 군집화를 보여주는 것이다.

<이상의 작업은 하루에 한번 이용량이 적은 시간대에 행해질 것이다. UI버전 + CUI버전 동시에 제공. UI버전은 실행과 동시에 작업이 진행된다.)
... 시간 소요 ...
 
4. 이제 그 바이너리 데이터를 기반으로 항시 "추천"이 가능하다.
4-1. 추천의 방법은 예를 들면, 최신 영화 100개를 대상으로 맞춤평점순 정렬을 시킨다든지, 특정 장르, 특정 검색어를 통해 "검색"과 동시에 맞춤평점을 평가하는 방식이 가능하다.
4-2. 또는 랜덤하게 추출한 100개의 영화중 맞춤평점이 높은 영화를 추천해 줄 수 있다.


* 프로토 타입만 생성가능 => 전시회이지 공모전이 아니기 때문이다...
* 실험데이터를 자주 참조하자.


궁금증 ** 왜 weight의 합은 1이 아닐까??????????????

:
Posted by Kwang-sung Jun
2008. 2. 10. 22:32

시각화의 한 방법 netflix prize2008. 2. 10. 22:32

생각조각..

아마도 아래와 같은 그림은
두 가지 다른 "유사도"측정 방식을 이용했을 것이다.
예를 들어, x축을 위해서는 support밸류가 유효한 유사도, y축을 위해서는 support밸류가 유효하지 않은 것. 또는 Beta값이 다른 유사도 ...

netflixprize.com

사용자 삽입 이미지
:
Posted by Kwang-sung Jun
2008. 2. 10. 18:07

day 26_2 netflix prize/일지2008. 2. 10. 18:07

netflix prize research day 26_2

오늘 한일은 다음과같다

  • NonNegativeQuadraticOpt알고리즘을 잠정적으로 완성

  • probe_gen(probe.txt 를 probe라는 바이너라 피일로 변환)완성 및 테스트 완료
  • ProbeReader(바이너리 파일 probe를 읽어낸다.)클래스 완성 및 테스트 완료


TODO

각 유져와 무비 페어에 대해.
• N(i;u)를 구한다. 즉 u가 rating했던 아이템중 i와 비슷한 아이템 20개를 선정한다.(20이 안되는 경우는 assert걸어둔다.)
• 20 * 20 매트릭스 A, 20 * 1 벡터 b를 작성하고, 알고리즘을 이용하여 w를 구한다. (->여기서 문제가 발생하고 있다. length가 점점 커지다가 조건에 걸려서 종료되어야 하는데, length는 갈수록 작아져만 간다...) => K값을 줄인후 알고리즘을 하나하나 추적하여 뭐가 잘못된지 발견해내자.
• ProbeReader를 이용하여 probeset을 읽고 정답을 채우자.
* 정답을 채워넣는 클래스도 만들어내면 편할 듯.


  - 통계프로그램을 구했으니 슬슬 자료 분석도 시작해 봐야지

문제해결법에 대한 IDEA

*. 영화제목으로부터 연관관계를 끌어낼 수 있을까(시리즈물, 어두운 분위기, 공포 등)

 - WWE
 - soldier
 - Dark
 - dragon ball
 - national geographic
 - 영화제목에 위의 단어가 들어있다면. 이용자가 시리즈물을 보고 평가한 결고를 반영할 수 있다.
 - (user base + item base)
 - 자주 검색되는 단어를 이용해도 된다.
 
*. 시간적으로 '최근' 취향이 비슷할 수록 가중치가 높아진다.
 - user간에 얼마나 '많은' 영화의 평점이 얼마나 '많이'같은지, 그 각각의 영화가 얼마나 시기적으로 '가까운'지에
대하여 유사도를 계산한다..

=> 뭐 이딴것들은 다 논문에 나와있더라.. user-based approach와 item-based approach는 이미 다 나와있고... 상대적으로 item-based approach가 더 좋은 속도와 결과를 내지만,
나중에 데이터 짬뽕시키는게 적중률을 향상시키기에 시도는 했다 하더라.
:
Posted by Kwang-sung Jun